August 7 2019
12pm-1pm
Location
Virtual hui | To participate via ZOOM, please register first by clicking the below link
DSC Seminar | Sea level rise PLUS big storms: What exactly are we in for?
Councils across New Zealand are declaring climate emergencies. But what climate information are they using to make their decisions and inform their communities? In this seminar, we’ll hear from Ryan Paulik and Rob Bell (NIWA), whose ground-breaking research investigates how flooding will get worse under climate change – both at the coast and inland, alongside our rivers.
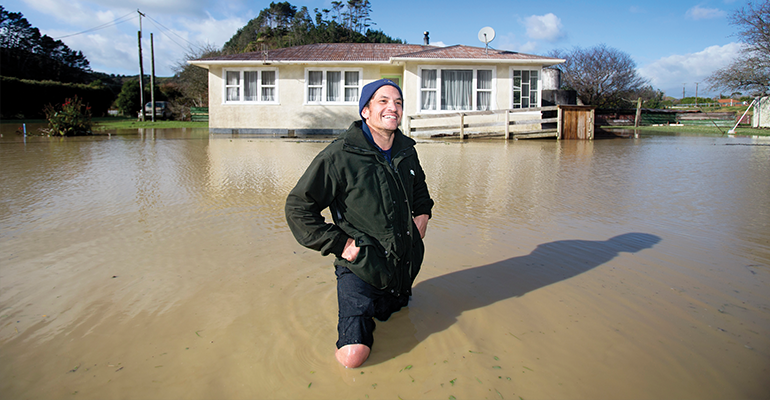
Recent cyclones have shown us how vulnerable we all are to extreme weather – whether we’re living on the coast or inland in a flood-plain.
But what happens when you add 10cm or 30cm or 1m of sea level rise to the picture? Or when big rain events hit rural areas, or towns, or cities, that may not have been hit so badly before?
The research builds on and improves national flood mapping carried out by the Parliamentary Commissioner for the Environment in 2015, and provides a comprehensive picture of the impact of coastal and inland flooding on our national infrastructure, including our buildings, roads, railways, airports, electricity transmission lines, water infrastructure and farms.
Due for release in September, the research is presented in two reports. The first describes what infrastructure will be exposed for every 10cm of sea level rise (up to 3m), including when coupled with one-in-100-year storms. For example, 30 centimeters of sea level rise (foreseeable in the next 30 years) would expose $18.49 billion worth of buildings around New Zealand to flooding. Further, 2,000 kms of roads, 112 kms of railway tracks, 4,000 kms of water pipelines, 1,600 sq kms of agricultural land, 14 domestic / international airports would also be exposed. Slide up to 1m of sea level rise, and the dollar value of exposure increases to $39 billion.
The second report maps inland flood risk against infrastructure, and finds, for example, that a staggering $135 billion worth of buildings are potentially exposed. Add to this almost 19,000 kms of roads, 1,500 km of railway tracks, 21,173km of water pipelines, 3,397 km of national grid transmission lines and 20 airports, and you begin to get a sense of the challenges ahead of us. But if we can accurately predict the areas of highest risk, we can better adapt, minimising harm to New Zealand’s population and economy.
Come and gain an overview of these reports in advance of release, understand the limitations of the data and the team’s recommendations for further research.
This research will support further development of RiskScape (open access software developed by NIWA and GNS Science), which can directly help those people whose job it is to manage flood risk.
Physical hubs:
- NIWA Wellington: Conference Room*
- NIWA Christchurch: TerraNova Room
- NIWA Lauder: Computer Room
- University of Canterbury: Meremere 411
- School of Law Building: University of Otago:
- Conference Room (Room 314): Physics Department
*Our presenters will be speaking from this hub.
Please note, all visitors to NIWA must sign in on arrival.
We encourage you to set up your own hub and bring friends and colleagues together to participate in the seminar. Please let us know if you do set up your own hub.
Email: [email protected]
ABOUT OUR PRESENTERS
Ryan Paulik
Ryan Paulik, NIWA, is a researcher of natural hazards and leads the research into disruption of infrastructure due to coastal flooding. He has experience in a broad range of areas including natural hazard impact and risk assessment, post-event damage surveys, and vulnerability modelling. Ryan works with a range of organisations to apply natural hazard impact and risk information to disaster risk management activities.